|
Controlling the Engineering progress of an industrial project is not an easy task. The KPIs used are in general not fit for purpose, ‘cause they miss to catch the iterative nature of innovation. Read further if you want a new set of metrics capable to measure the iterative and the collaborative Client-Supplier efforts of your team. ( and do not forget to ask for our free software to manage all this…. the Control Room , here)
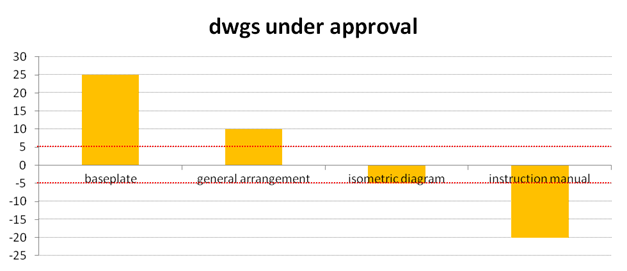
Dear Fellow Innovator, I just completed a project where I helped a supplier of equipment and services to the Oil & Gas and Energy industry, put under control the documentation exchanged with customers and suppliers. When you have to handle thousand of documents per project, each easily revised up to a dozen of times, it is not immediate to have a clear idea of VDR (Vendor Documents Register) situation: · how many drawings have to be issued or revised for Customer approval, · how many are the ones Customers has to return, commented or finalized, · which are the drawings sent just for information and · what is the status of approval of quality procedures, etc. The Project Leader of both parties: Client and Supplier have to figure out the engineering progress, discover criticalities, identify responsibilities for delays, roadblocks and idle situations in order to take the correct decisions and push on the most effective resources. Why “S” Curves and “Gannt” diagrams don’t work. Often, despite a team of Document Controllers is in place, having a clear metric of the situation, a graph that in one blink of the eye gives the perception of where the project is ending up, is a dream for Project Managers and Project Engineers. The reasons are several, ranging from managing complexity: · The objective complexity of the task: 1000 drawings by 10 revisions is a lot! · The number of parties involved: 3 main (Client, Supplier, Sub-supplier) · The number of actors involved: dozen of offices and Professionals to the different type of process underpinning the project progression in these activities: · The engineering is a collaborative task, not a push-pull task as in manufacturing · The engineering development is iterative. This collaborative and iterative approach at the task to be performed, is not tracked by usual charts and project management control methodologies. Both “S” Curves and “Gannt” diagrams fails miserably in capturing this complexity. They are perfect to picture the progress of sequential events, but perform poorly in giving feedbacks of the engineering phases, when dozen of transmittals are sent back and forth across the tables of Customer and Supplier. Using a different perspective: For these reason when I was a Project Manager I have developed a different set of metrics, that look at the problem from another point of view. First, I realized that when in the middle of the project I really did not need to know the revision reached by each single document. Whatever it is, it deserved, dot. Second, what I really need to know is “where is the document”. Is it in my hands or in those of the Customer? If I deem the document critical for the project, do I have to blame my team or chase the Client for an urgent return? Stop blaming, start cooperating with Customer: Third, I wanted a metric that was able to put me and the Customer on the same level. One that was able to clearly depict the overall situation: no matter if it was my team or the client’s team responsibility for delays or criticalities. On a Project, we are all on the same boat, Customer and Supplier, and a collaborative approach speed up results. But it needs an open and frank discussion that can be made only if all the data are on the table, ours and theirs. How the metrics work: So what I did was to start count the days since a document was received by one of the party, regardless of the revision number. Then I put these days on a graph, with a positive value if the document was in Customer hands, with a negative value if they were in my hands.
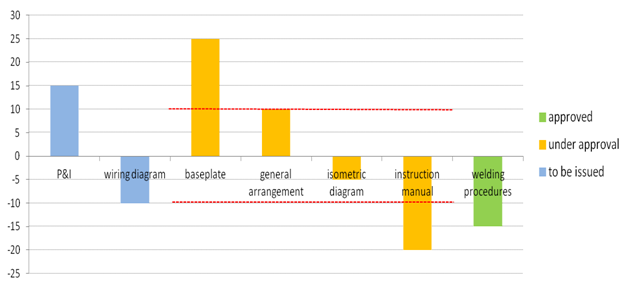
In this way it was immediately understandable where the workload was, if the documents were in delays respect a maximum allowed return time ( see red lines on the graph) and, with some filter on the graph: who was in charge to re-issue the document. After a while I added a color to distinguish documents “final approved” and documents “still to be issued” for the first time. The result is this graph:
Here is how the graph should be read: Blue section: Documents never issued ( here negative drawings are the ones to be issued, still on time. Positive drawings are to be issued, but are in delay) · The P&I should have been issued 15 days ago · The Wiring diagram has to be issued in 10 days Orange section: Documents under approval (here positive drawings are in customer hands and negative are in our hands) · The Baseplate should have been revised 15 days ago, by the Customer · The General Arrangement should be revised today, by the Customer · The Isometric diagram should be revised in 5 days, by us · The Instruction Manual should have been revised 10 days ago, by us. Green section: Documents approved (here the drawings returned as final by the Client are “stored”) · The Welding procedures returned 10 days ago, approved
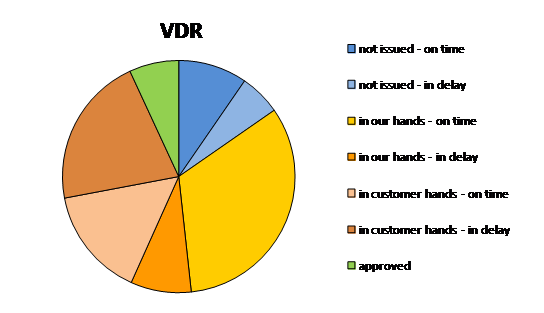
The graph can be summarized into a pie chart like this:
And used in management decisions. How the metric can be used in management decision: I have recently implemented these metrics in a rotating equipment supplier’s engineering department, creating a software capable to track each drawing’s issue, its revision and the transmittal issue or return from Client. The Company Projects Director is now able to have the Engineering situation at his fingertips, both at projects’ portfolio level as well drilling down in each single project. He can prepare summary reports with one click, that can show the situation for each project or for any of the Engineering COE (center of excellence). He can easily demonstrate when the customer has been a bit lazy in returning documents in a fair and quantitative way, so rejecting the request for liquidated damages due to delivery’s delay that can be easily routed to Customer overload. The logic - after a 5 minute explanation and attention - is quite straightforward and easily implemented. After all, is about “who is in charge” of the document and when he has to close the task. If you want to know more about these metrics and the software supporting them, how they can be used to streamline Engineering operations and track documents transmittal, feel free to contact me. Flavio
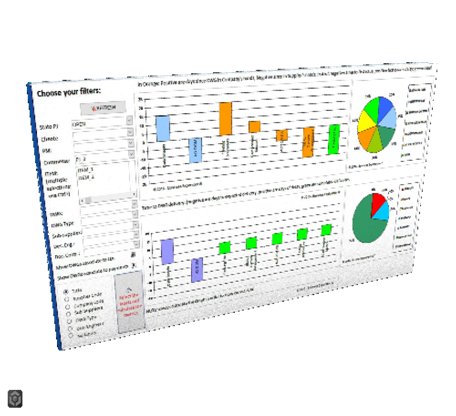
PS: yes the Control Room Software exists and it’s available free of charge.
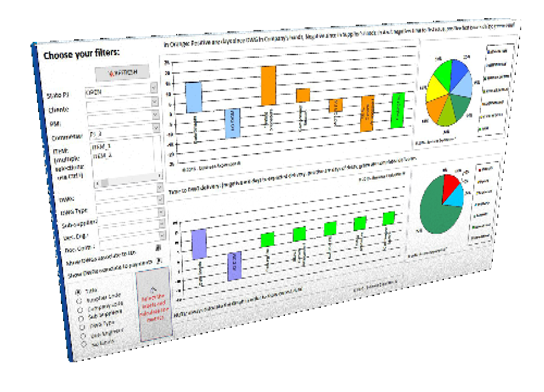
The Control Room allows your Document Controller to upload the transmittal’s data, the drawing details, the drawing office, design engineer and classification.
Plus allows you to draw automatically the KPIs plots, filtered as you prefer.
And much more. Just Ask!
|


|
Put your engineering documents under control with this innovative VDR progress KPIs (free software included) |
|
How to put VDR documents under control
|
|
Little nightly thoughts by Business Exploration® |
|
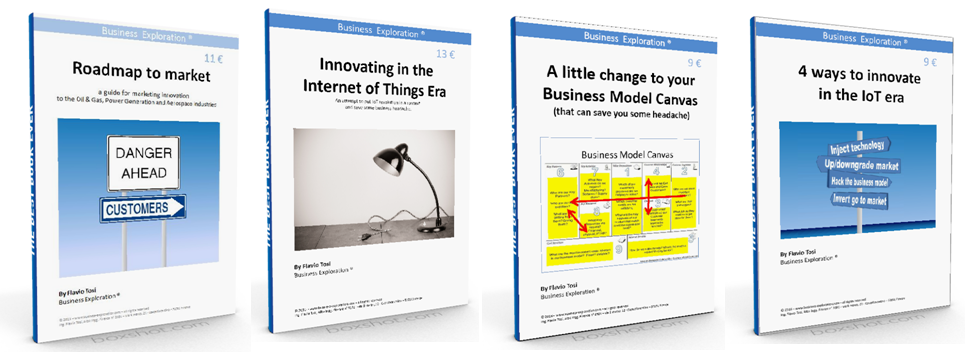
Read more about marketing B2B innovation, Ask for our free booklets: here |

|
Business Exploration
London: +44 7491 164 097 Milan: +39 02 8719 8498 Florence +39 349 648 2225
Info@business-exploration.com
P.Iva: IT 05998900483 © 2016 - all rights reserved
|
|
Addresses:
16 Perham Road - W14 9ST - London - UK c/o IF-Milano - Coworking space - via Torre, 29 - 20143 - Milano via 8 marzo, 22 - 50051 - Castelfiorentino - Tuscany - Italy
Check out our 8-days Marketing Coaching Program
|
|
Faster Engineering execution? Less costs overruns? |

|
Ask about our methodology for Engineering Automation EU-Engineering |
|
Do you need more efficiency for your Engineering? read more: |
|
Stop screaming Start manage your knowledge: Avoid Engineering Errors |